SDA Cloud Creating Reports
Getting information into SDA Cloud is as easy as saving a file, and gleaning the most important pieces of actionable data is as easy as filtering, sorting and organizing your data the way you need to see it. Once you’re ready to create visuals and reports on your sales pipeline, you can use SDA Cloud to export your data to a .csv file, where you can use the Excel charting and reporting capabilities to create your presentation materials.
- Apply any filters and sort the opportunity data in your grid so that you are looking at the information you want to report on.
- Click on the EXPORT button at the top of the SDA Cloud screen
The SalesManager Report Options selector will display. Select the way you would like to subtotal the output by:
- Owner
- Stage
- Owner then Stage
- Stage then Owner
- Add weighted sell column
- Click the OK Button
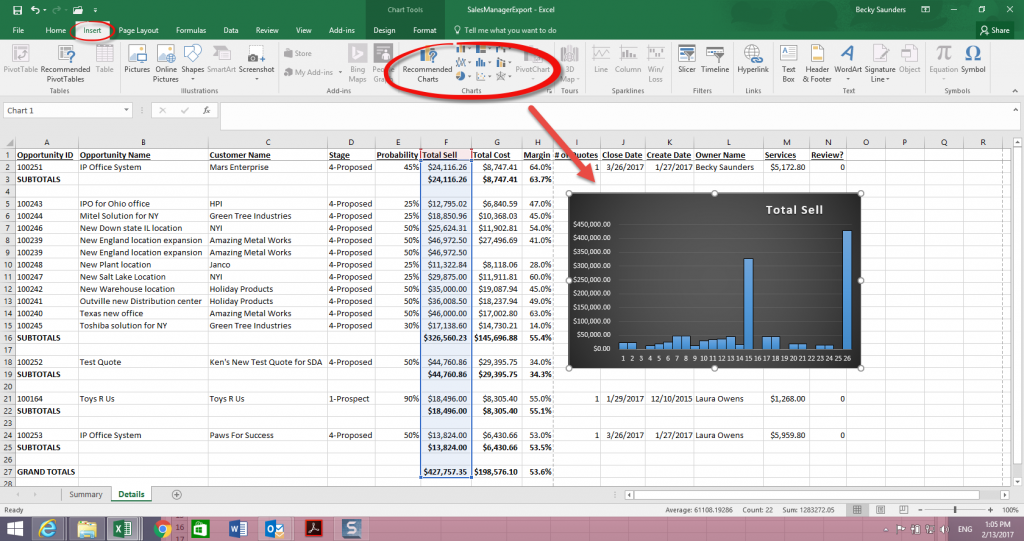
- Open the exported file you just created and select a column of data to report on. Click the INSERT button at the top of Excel and select the type of chart you
want to create from your selected data – Pie, Bar, Scatter, etc. You’ll be able to use the other data in the .csv file for your legends, titles, labels, etc. - Share the graphics you create with other applications (slideshare, powerpoint, etc.) You can select the chart and save as a picture, or use a screen capture
application to save the graphic and the quote information on your screen. - You might want to save the .csv file for future reference, in case you need to create additional reports on that view.